Dec
From Metrics to Mastery: A Beginner’s Guide to Monitoring AWS with Grafana and Prometheus
Managing infrastructure on AWS is powerful, but understanding what’s happening inside your systems in real time is even more important. If you’re using services like EC2, Lambda, or RDS, you need a way to visualize performance, detect issues, and respond quickly. That’s where Grafana and Prometheus come in. In this blog, you’ll learn how to connect a self-hosted Grafana setup with AWS CloudWatch and how to use it to create dashboards and alerts for your AWS environment.
What is AWS CloudWatch?
AWS CloudWatch is a built-in monitoring and observability service provided by AWS. It automatically collects metrics and logs from AWS services. For example, it shows CPU utilization on EC2, the number of invocations for Lambda, or database connections in RDS. While CloudWatch gives access to these important metrics, the dashboard and visual experience are quite basic, especially if you’re managing multiple services. This is where external tools like Grafana become essential.

Introduction to Grafana
Grafana is an open-source tool used to visualize time-series data. It helps convert raw metrics into visual dashboards that are easy to read and understand. With Grafana, you can build custom dashboards to monitor multiple services across AWS accounts in one place. It also allows you to create alerts and share dashboards with your team, making it a practical solution for real-time infrastructure monitoring.
Role of Prometheus in Monitoring
Prometheus is another open-source tool, but its focus is on collecting and storing metrics—especially from applications, services, and exporters. In setups where you want more than just AWS-level data—like custom metrics from an app, web server, or database—you can add Prometheus alongside CloudWatch. For this blog, we are focusing on CloudWatch integration, and Prometheus can be introduced later if needed.
Step 1: Give Grafana Access to AWS CloudWatch
To allow Grafana to read data from CloudWatch, it needs permission via AWS IAM. If Grafana is hosted on an EC2 instance, the easiest way is to attach an IAM role with read-only permissions for CloudWatch and EC2. If Grafana is running locally or outside AWS, you can create an IAM user and use the access key and secret key in Grafana. The IAM policy should include permissions like cloudwatch:GetMetricData and ec2:DescribeInstances.
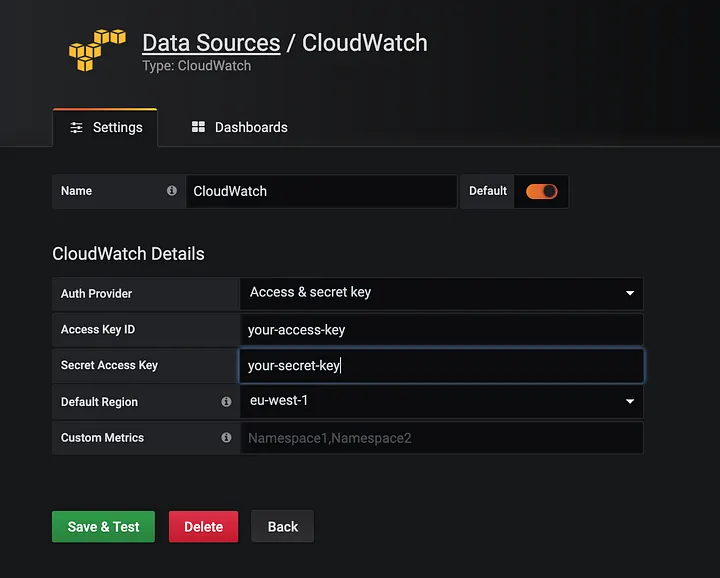
Step 2: Add AWS CloudWatch as a Data Source in Grafana
After setting up the right permissions, go to the Grafana dashboard and open the Data Sources section. Click on “Add Data Source” and choose “CloudWatch”. In the configuration, select your AWS region, and choose how Grafana should authenticate—using either access keys, an IAM role, or the default credentials file. Once saved, test the connection to confirm that metrics can be fetched from CloudWatch.
What You Can Monitor Using CloudWatch in Grafana
Once connected, you can start building dashboards using AWS metrics. For example, if you’re monitoring EC2 instances, you can create panels for CPU usage, network activity, and disk operations. For Lambda functions, it’s common to track the number of invocations, error counts, and execution time. If you’re using RDS, metrics like free storage space, CPU load, and database connections can be plotted. Grafana allows you to mix and match these panels to build a single view of your environment.
You can also import pre-built dashboards from Grafana’s dashboard library. These templates are available for EC2, Lambda, RDS, and more, and they offer a quick way to get started without building everything from scratch.
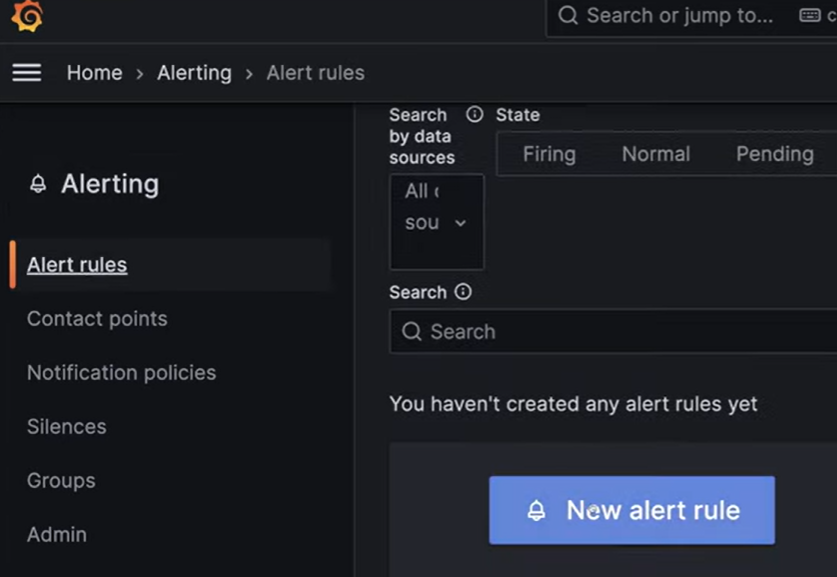
Setting Up Alerts in Grafana
Beyond visualization, Grafana allows you to configure alerts based on specific conditions. For instance, you might want to be notified if an EC2 instance’s CPU usage goes above 80% for several minutes, or if a Lambda function starts returning errors. Grafana supports alerts via email, Slack, Teams, and other tools. Alerts can be created directly within the dashboard panels and offer flexible rule creation with thresholds and conditions.
Summary
Integrating AWS CloudWatch with Grafana gives you a powerful solution to monitor your cloud infrastructure in real time. Grafana transforms basic metrics into rich visualizations, helps you identify issues faster, and provides alerting to ensure quick responses. While CloudWatch is the source of data, Grafana enhances visibility and usability. Later, Prometheus can be added to monitor application-level metrics, creating a complete monitoring solution.

Nihal Rajput is the Operations Director at Ficode Software Solutions Pvt. Ltd., where he oversees day-to-day operations, streamlines processes, and drives organisational efficiency. With a focus on delivering scalable solutions and maintaining operational excellence, he plays a key role in aligning teams, optimising resources, and ensuring client satisfaction as the company grows.